Atlanta Market Report: June 2026
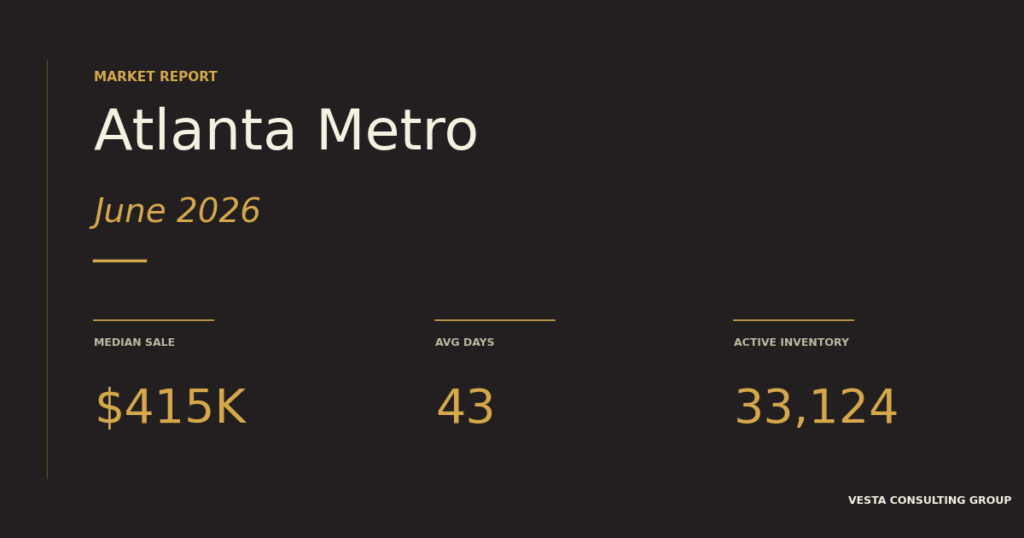
Here’s how Atlanta‘s housing market moved through June 2026. The median sale landed at $415,000, homes typically closed after 43 days on market, and 33,124 active listings were available going into July 2026. What that means for you depends on whether you’re buying, selling, or watching.
Atlanta Metro at a Glance
- Median close price: $415,000
- Average days on market: 43 days
- Active inventory: 33,124 listings
These numbers describe the metro as a whole, and metro averages smooth out a lot of real differences between counties and neighborhoods. The county-level view below is where the story actually lives.
How Each County Performed
The metro is a patchwork. Here’s how the six core counties compared this month:
| County | Closed | Median Close | Avg DOM | Active |
|---|---|---|---|---|
| Fulton | 1,078 | $535K | 39 | 5,973 |
| Gwinnett | 768 | $420K | 36 | 3,877 |
| Cobb | 761 | $460K | 33 | 3,128 |
| Dekalb | 649 | $405K | 42 | 2,832 |
| Cherokee | 379 | $480K | 41 | 1,674 |
| Forsyth | 342 | $625K | 40 | 1,625 |
What This Means Depending on Where You Sit
If you’re buying
Atlanta gave buyers more time to think this month. A 43-day average on-market means the frenzy of a tight spring has eased in most of the metro. That doesn’t mean every submarket is soft. Buckhead, Intown walkables, and the top schools zones still trade fast. It does mean that outside of those pockets, you can usually tour a house twice, review inspection reports carefully, and negotiate a reasonable contract. What number would you be upset to lose the house at? That’s the number to anchor to, not the asking price.
If you’re selling
With 33,124 active listings out there, buyers have options. Pricing matters more this month than it did in April of last year. If your home has been up more than 21 days with fewer than 10 showings, the data usually points to one of three things: the price is off, the marketing isn’t reaching the right buyers, or the property itself needs to show better. Each has a different fix, and which one you need matters.
If you’re watching
We send this report every month. If you’re tracking Atlanta for a move in 6 or 12 months, the monthly cadence lets you see the arc instead of reacting to any one data point. Nothing in a single month should change your plan. Several months in the same direction is what matters.
Frequently Asked Questions
Zillow’s “typical home value” is a statistical estimate across all homes in a ZIP (closed sales, active listings, and homes that aren’t on the market at all). The $415,000 figure above is the median of actual closed sales in June 2026 pulled from FMLS. Different inputs, different numbers, both correct for what they measure.
We pull directly from FMLS via the Bridge Interactive data feed. Closed transactions for June 2026 continue to record for several weeks after the month ends, so if you’re reading this in the first half of July 2026, the numbers may update slightly as late closings post.
Book a 15-minute call and we’ll add you to the monthly list. No sales pitch attached.
Talk Through Your Situation
Numbers are useful, but they’re general. Your buy or sell is specific. If you want to walk through what June 2026’s data means for your block, your timeline, or a house you’ve been watching, book 15 minutes with Valerie. Here’s her calendar. Or send a note through the contact page, whichever is easier.
Source: FMLS via Bridge Interactive, aggregated by Vesta Consulting Group. Data reflects Atlanta metro listings in the VCG FMLS sync as of the generation time. Historical backfill is ongoing; counts for months older than a few weeks will update as additional listings sync. For the most recent full snapshot, always use the latest generated report.